
今回は引き続き、Faster-R-CNNを用いた物体検出モデルの実装を行っていきます。
いよいよ最終段階の評価編になります。
ここでは、物体検出モデルの評価指標として有名なmAPの値を算出していきます。
それでは行ってみよう。
評価指標mAPとは?
陽性 or 陰性の分類
mAPとは主に物体検出モデルを評価する際に用いられる評価指標です。
医学の分野では、よくROC-AOUを評価指標として使用することが多いと思います。
ROC-AOUの概念図を以下に示します。
| 癌である | 癌でない | |
| 陽性 (癌であると予測) | TP | FP |
| 陰性 (癌でないと予測) | FN | TN |
\[Precision=\frac{TP}{TP+FP}\]
\[Recall=\frac{TP}{TP+FN}\]
つまり、
\[Precision=\frac{癌を正しく陽性と判断した数}{陽性と判断された数}\]
\[Recall=\frac{癌を正しく陽性と判断した数}{実際に癌である数}\]
となります。
物体検出の場合
物体検出の場合には、正解と予測のBboxの重なり具合に加えて、クラスが一致しているかも評価する必要があります。
そのため、物体検出の場合には評価指標の考え方が少し異なってきます。
特定のラベルのTP, FP, TNは以下のようにして決まります。
| 正解 | 不正解 | |
| 予測された | TP | FP |
| 予測されなかった | FN |
それぞれを日本語に変換すると以下のようになります。
TP:正しく予測された
FP:誤って予測されたTN:予測されなかったことが正しい(予測されなくて当然)
FN:予測されなかったことが間違っている(予測されるべきだった)
ここで注意が必要なのが、TPとFPは予測Bboxを基準に分類される一方、FNは正解Bboxを基準に分類される点です。
つまり、上記のTP, FP, FNを言い換えると以下のようになります。
TNは無限に考えられるor数の概念がないため、定義されないものとなっています。
TP:IOUの値が閾値以上の予測Bboxの数(正解Bboxとほとんど重なっている予測Bboxの数)
FP:IOUの値が閾値以下の予測Bboxの数(正解Bboxとほとんど重なっていない予測Bboxの数)TN:背景やその他の物体に予測Bboxがない場合の数
FN:どの予測Bboxとも重なっていない正解Bboxの数
PrecisionとRecallは以下のようにして決まります。
\[Precision=\frac{TP}{TP+FP}\]
\[Recall=\frac{TP}{TP+FN}\]
つまり、
\[Precision=\frac{IOUが閾値以上の予測Bbox}{全ての予測Bboxの数}\]
\[Recall=\frac{IOUが閾値以上の予測Bbox}{全ての正解Bboxの数}\]
その後、各クラスのAPを算出し、その平均であるmAPを計算します。
\[AP=\int_0^{1} p(r)dr\]
\[mAP=\frac{AP_1 + AP_2 + … + AP_n}{n(クラス数)}\]
補足
先ほど、TPとFPはIOUの値で分類されていると言いましたが、厳密には以下のように割り振られています。
以下のように、全ての予測BboxをConfidence scoreの高い順に並び替えていきます。
| Sorted number | Confidence score | Correct | Precision | Recall |
|---|---|---|---|---|
| #1 | 0.95 | True | 1/1=1 | 1/5=0.2 |
| #2 | 0.90 | False | 1/2=0.5 | 1/5=0.2 |
| #3 | 0.85 | True | 2/3=0.67 | 2/5=0.4 |
| #4 | 0.80 | Frue | 2/4=0.5 | 2/5=0.4 |
| #5 | 0.75 | False | 2/5=0.4 | 3/5=0.6 |
| #6 | 0.70 | False | 2/6=0.33 | 3/5=0.6 |
| #7 | 0.65 | True | 3/7=0.43 | 3/5=0.6 |
| #8 | 0.60 | True | 4/8=0.5 | 4/5=0.8 |
| #9 | 0.55 | False | 4/9=0.44 | 4/5=0.8 |
| #10 | 0.50 | True | 5/10=0.5 | 5/5=1.0 |
その後、Scoreの高い順に「予測Bboxが正解BboxとIOUの閾値以上に重なっているか」「まだ他の予測Bboxと紐づいていないか」を基準にTrueおよびFalseを割り振っていきます。
このようにして、ある時点におけるTP, FPの値からPrecisionを算出しています。
mAP算出ツール
上記で説明したように、mAPの計算を一から実装するのはかなり手間ですよね。
そのため、今回はmAPを計算するにあたり、以下のパッケージを使用させていただきました。
使い方などについて以下のサイトの説明文をご覧ください。
mAP算出ツール
mAPの実装
上記のパッケージを使用するには規定の入力ファイルを作成する必要があります。
入力ファイルおよびシェルスクリプトの中身は以下のようになっています。
入力ファイル(truth)
6 254.6455078125 299.0730285644531 425.8539733886719 691.33544921875入力ファイル(predict)
1 0.9933149218559265 347.6226806640625 372.6163635253906 780.2117309570312 800.2754516601562
3 0.7374333739280701 223.33868408203125 204.72628784179688 798.189208984375 711.6409301757812
6 0.41540729999542236 542.61328125 423.2575378417969 765.3599853515625 746.041015625
シェルスクリプト
cd /content/drive/MyDrive/x_ray_chest/lib/map_tool
python pascalvoc.py -gt /content/drive/MyDrive/x_ray_chest/results/faster_r_cnn/v1/test/map/weight_0030/input/truth -det /content/drive/MyDrive/x_ray_chest/results/faster_r_cnn/v1/test/map/weight_0030/input/predict -gtformat xyrb -detformat xyrb -sp /content/drive/MyDrive/x_ray_chest/results/faster_r_cnn/v1/test/map/weight_0030/result
*入力ファイルの作成方法、引数などの使い方に関しては、パッケージの説明をご覧ください。
入力ファイルの準備ができれば、いよいよmAPの計算に入ります。
エポック数30のモデルを使用して予測結果を計算します。
device = torch.device('cuda') if torch.cuda.is_available() else torch.device('cpu')

model.to(device)

model_path = '/content/drive/MyDrive/x_ray_chest/results/faster_r_cnn/v1/weight/weight_0030.pt'
model.load_state_dict(torch.load(model_path))

test_results = []

model.eval()
with torch.no_grad():

    for batch in test_loader:
        image, target, name = batch

        image = image.to(device)

        predictions = model(image)

        #print(predictions)
        image = image.cpu()
        truth_boxes = target['boxes'][0].cpu()
        truth_labels = target['labels'][0].cpu()

        predict_boxes = predictions[0]["boxes"].cpu()
        predict_labels = predictions[0]["labels"].cpu()
        predict_scores = predictions[0]["scores"].cpu()


        dict_info = {'image':image, 'truth_boxes':truth_boxes, 'truth_labels':truth_labels, 'file_name':name,
                     'predict_boxes':predict_boxes, 'predict_labels':predict_labels, 'scores':predict_scores}

        test_results.append(dict_info)
予測結果からmAP計算ツールを使用するための入力ファイルを作成します。
def input_file_generator(test_results, weight_map_path):

    input_path = os.path.join(weight_map_path, 'input')
    result_path = os.path.join(weight_map_path, 'result')
    input_truth_path = os.path.join(input_path, 'truth')
    input_predict_path = os.path.join(input_path, 'predict')

    mkdir_path_list = [weight_map_path, input_path, result_path, input_truth_path, input_predict_path]

    for mkdir_path in mkdir_path_list:
        os.mkdir(mkdir_path)

    for i in range(len(test_results)):
        file_name = str(os.path.splitext(test_results[i]['file_name'][0])[0]) + '.txt'

        with open(os.path.join(input_truth_path, file_name), 'w') as f:

            truth_labels = test_results[i]['truth_labels'].tolist()
            truth_boxes = test_results[i]['truth_boxes'].tolist()

            for j in range(len(truth_labels)):
                row_data = []
                row_data.append(truth_labels[j])
                [row_data.append(box_data) for box_data in truth_boxes[j]]
                row_data = ' '.join(map(str, row_data))
                f.write(row_data + '\n')

    for i in range(len(test_results)):
        file_name = str(os.path.splitext(test_results[i]['file_name'][0])[0]) + '.txt'

        with open(os.path.join(input_predict_path, file_name), 'w') as f:

            truth_labels = test_results[i]['predict_labels'].tolist()
            truth_boxes = test_results[i]['predict_boxes'].tolist()
            scores = test_results[i]['scores'].tolist()

            for j in range(len(truth_labels)):
                row_data = []
                row_data.append(truth_labels[j])
                row_data.append(scores[j])
                [row_data.append(box_data) for box_data in truth_boxes[j]]
                row_data = ' '.join(map(str, row_data))
                f.write(row_data + '\n')

    sh_name = 'map.sh'
    with open(os.path.join(input_path, sh_name), 'w') as f:
        cmd1_row ='cd /content/drive/MyDrive/x_ray_chest/lib/map_tool'
        f.write(cmd1_row + '\n')
        cmd2_row = f'python pascalvoc.py -gt {input_truth_path} -det {input_predict_path} -gtformat xyrb -detformat xyrb -sp {result_path}'
        f.write(cmd2_row + '\n')
これで準備が整ったので、実際にmAPを算出していきましょう。
mAPの算出(特定モデル)
上記の実装で作成したinput_file_generator()を用いて、入力ファイルを作成していきます。
weight_name = os.path.splitext(os.path.basename(model_path))[0]
weight_map_path = os.path.join(test_folder_path, weight_name)

input_file_generator(test_results, weight_map_path)
次に、シェルスクリプトを使用してパッケージを実行し、mAPの算出を行います。
import subprocess

os.chmod(os.path.join(weight_map_path, 'input', 'map.sh'), 0o700)

os.chdir(os.path.join(weight_map_path, 'input'))
subprocess.run(['bash', './map.sh'], text=True)
計算結果
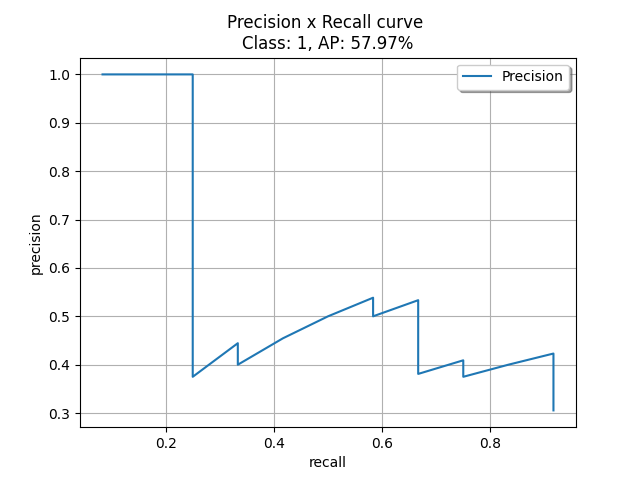
計算結果は各ラベルのAPおよびmAPの値を計算したテキストファイル、Recall, Precisionをx,y軸にとったRR-AUC曲線のグラフを出力します。
それぞれの結果を以下に表示します。
テキストファイル(結果)
Object Detection Metrics
https://github.com/rafaelpadilla/Object-Detection-Metrics


Average Precision (AP), Precision and Recall per class:

Class: 0
AP: 0.00%
Precision: []
Recall: []

Class: 1
AP: 57.97%
Precision: ['1.00', '1.00', '1.00', '0.75', '0.60', '0.50', '0.43', '0.38', '0.44', '0.40', '0.45', '0.50', '0.54', '0.50', '0.53', '0.50', '0.47', '0.44', '0.42', '0.40', '0.38', '0.41', '0.39', '0.38', '0.40', '0.42', '0.41', '0.39', '0.38', '0.37', '0.35', '0.34', '0.33', '0.32', '0.31', '0.31']
Recall: ['0.08', '0.17', '0.25', '0.25', '0.25', '0.25', '0.25', '0.25', '0.33', '0.33', '0.42', '0.50', '0.58', '0.58', '0.67', '0.67', '0.67', '0.67', '0.67', '0.67', '0.67', '0.75', '0.75', '0.75', '0.83', '0.92', '0.92', '0.92', '0.92', '0.92', '0.92', '0.92', '0.92', '0.92', '0.92', '0.92']

Class: 2
AP: 0.48%
Precision: ['0.00', '0.00', '0.00', '0.00', '0.00', '0.00', '0.00', '0.00', '0.00', '0.00', '0.00', '0.00', '0.00', '0.00', '0.00', '0.06', '0.06', '0.06', '0.05', '0.05', '0.05', '0.05', '0.04']
Recall: ['0.00', '0.00', '0.00', '0.00', '0.00', '0.00', '0.00', '0.00', '0.00', '0.00', '0.00', '0.00', '0.00', '0.00', '0.00', '0.08', '0.08', '0.08', '0.08', '0.08', '0.08', '0.08', '0.08']

Class: 3
AP: 6.94%
Precision: ['0.00', '0.50', '0.33', '0.25', '0.20', '0.17', '0.14', '0.12', '0.11', '0.10', '0.09', '0.08', '0.08', '0.07', '0.07', '0.12', '0.12', '0.11', '0.11', '0.10', '0.10']
Recall: ['0.00', '0.11', '0.11', '0.11', '0.11', '0.11', '0.11', '0.11', '0.11', '0.11', '0.11', '0.11', '0.11', '0.11', '0.11', '0.22', '0.22', '0.22', '0.22', '0.22', '0.22']

Class: 4
AP: 0.00%
Precision: ['0.00', '0.00', '0.00', '0.00', '0.00', '0.00', '0.00', '0.00', '0.00', '0.00', '0.00', '0.00']
Recall: ['0.00', '0.00', '0.00', '0.00', '0.00', '0.00', '0.00', '0.00', '0.00', '0.00', '0.00', '0.00']

Class: 5
AP: 14.29%
Precision: ['1.00', '0.50', '0.33']
Recall: ['0.14', '0.14', '0.14']

Class: 6
AP: 0.00%
Precision: ['0.00', '0.00', '0.00', '0.00', '0.00', '0.00', '0.00', '0.00', '0.00', '0.00', '0.00', '0.00', '0.00', '0.00', '0.00', '0.00', '0.00', '0.00', '0.00', '0.00', '0.00', '0.00', '0.00', '0.00', '0.00', '0.00', '0.00', '0.00', '0.00', '0.00', '0.00', '0.00', '0.00', '0.00', '0.00', '0.00', '0.00', '0.00', '0.00']
Recall: ['0.00', '0.00', '0.00', '0.00', '0.00', '0.00', '0.00', '0.00', '0.00', '0.00', '0.00', '0.00', '0.00', '0.00', '0.00', '0.00', '0.00', '0.00', '0.00', '0.00', '0.00', '0.00', '0.00', '0.00', '0.00', '0.00', '0.00', '0.00', '0.00', '0.00', '0.00', '0.00', '0.00', '0.00', '0.00', '0.00', '0.00', '0.00', '0.00']

Class: 7
AP: 0.00%
Precision: ['0.00', '0.00', '0.00', '0.00', '0.00', '0.00', '0.00', '0.00', '0.00', '0.00', '0.00', '0.00']
Recall: ['0.00', '0.00', '0.00', '0.00', '0.00', '0.00', '0.00', '0.00', '0.00', '0.00', '0.00', '0.00']


mAP: 9.96%
グラフ(結果)
mAPの算出(全てのモデル)
次に、全てのモデルに対してmAPを計算していきます。
ここでは全てのモデルの予測結果を計算しています。
そして、予測の計算結果を元に、入力ファイルやシェルスクリプト、結果ファイルのパスなど必要な項目を設定しています。
最後に、シェルスクリプトを実行させて、mAPを計算します
import random
import shutil
from PIL import Image, ImageDraw
from torch import tensor
import subprocess


map_path = os.path.join(test_folder_path, 'map')
os.mkdir(map_path)

device = torch.device('cuda') if torch.cuda.is_available() else torch.device('cpu')

model.to(device)

weight_dirs = glob(os.path.join(weight_folder_path, 'weight_*'))

for weight_dir in weight_dirs:

    weight_name = os.path.splitext(os.path.basename(weight_dir))[0]

    model.load_state_dict(torch.load(weight_dir))

    test_results = []

    model.eval()
    with torch.no_grad():

        for batch in test_loader:
            image, target, name = batch

            image = image.to(device)

            predictions = model(image)

            #print(predictions)
            image = image.cpu()
            truth_boxes = target['boxes'][0].cpu()
            truth_labels = target['labels'][0].cpu()

            predict_boxes = predictions[0]["boxes"].cpu()
            predict_labels = predictions[0]["labels"].cpu()
            predict_scores = predictions[0]["scores"].cpu()


            dict_info = {'image':image, 'truth_boxes':truth_boxes, 'truth_labels':truth_labels, 'file_name':name,
                         'predict_boxes':predict_boxes, 'predict_labels':predict_labels, 'scores':predict_scores}

            test_results.append(dict_info)


    weight_map_path = os.path.join(map_path, weight_name)

    input_file_generator(test_results, weight_map_path)

    os.chmod(os.path.join(weight_map_path, 'input', 'map.sh'), 0o700)

    os.chdir(os.path.join(weight_map_path, 'input'))
    subprocess.run(['bash', './map.sh'], text=True)
次にmAPの計算結果ファイルから、正規表現でmAPの値を抽出し、map_result_dfに情報を格納します。
from glob import glob
import re
import pandas as pd
import os

def map_read(pathdir1):

    map_path = os.path.join(test_folder_path, 'map')

    epoch_list = []
    map_value_list = []

    for i in range(len(pathdir1)):

        epoch = i + 1
        epoch_list.append(epoch)

        weight_dir = f'weight_{epoch:04}'
        result_file_path = os.path.join(map_path, weight_dir, 'result', 'results.txt')

        with open(result_file_path, 'r') as f:
            txt_data = f.read()
            pattern = 'mAP: (\d+\.\d+)%'
            map_value = re.findall(pattern, txt_data)
            map_value_list.append(float(map_value[0]))

    map_result_list = [epoch_list, map_value_list]
    map_result_df = pd.DataFrame(map_result_list, index=['epoch', 'map']).T

    map_result_df.to_csv(os.path.join(test_folder_path, 'map.csv'), columns=['epoch', 'map'])

    return map_result_df
最後にエポック数ごとのmAPの値を可視化します。
import pandas as pd
import matplotlib.pyplot as plt
import os
pathdir1 = glob('/content/drive/MyDrive/x_ray_chest/results/faster_r_cnn/v1/test/map/*')
map_result_df = map_read(pathdir1)
print(map_result_df)
plt.rcParams['font.family']= 'sans-serif'
plt.rcParams['xtick.direction'] = 'in'
plt.rcParams['ytick.direction'] = 'in'
plt.rcParams['xtick.major.width'] = 1.2
plt.rcParams['ytick.major.width'] = 1.2
plt.rcParams['font.size'] = 10
plt.rcParams['axes.linewidth'] = 1.2
plt.rcParams['axes.grid']=True
plt.rcParams['grid.linestyle']='--'
plt.rcParams['grid.linewidth'] = 0.3
plt.rcParams["legend.markerscale"] = 2
plt.rcParams["legend.fancybox"] = False
plt.rcParams["legend.framealpha"] = 1
plt.rcParams["legend.edgecolor"] = 'black'
fig, ax = plt.subplots(1, 1, figsize=(8, 6))
ax.plot(map_result_df['epoch'], map_result_df['map'])
ax.set_xlim(0, 200)
ax.set_ylim(0, 30)
ax.set_xlabel('epoch')
ax.set_ylabel('mAP')
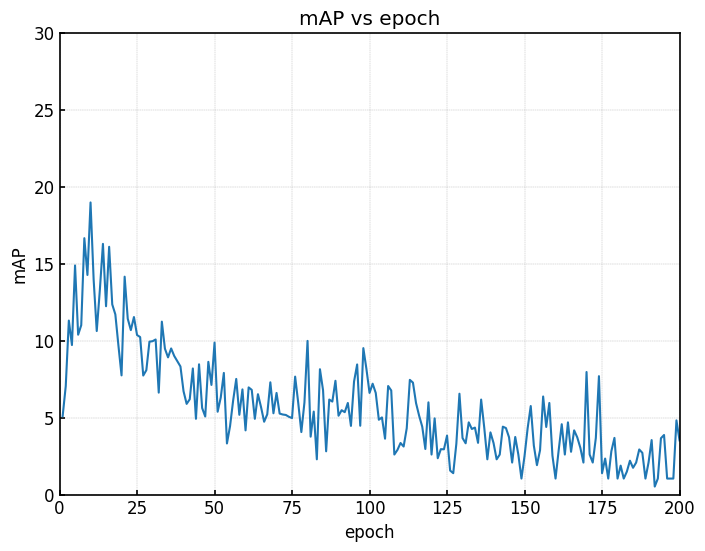
plt.show()
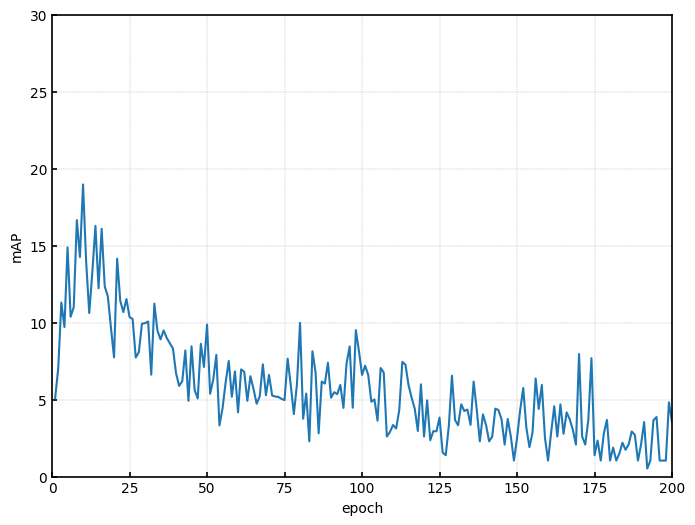
結果として、エポック数10あたりで最もmAPの値が高くなり、エポック数が増加するごとにmAPの値が低くなっています。
学習をさせるほど評価指標が悪くなるのは何とも残念な結果ですね。
総評
mAPの結果について
推論の記事の結果を見てもわかるように、全体的に精度が芳しくないですね。
エポック数が小さいモデルではmAPの値が10〜20程度になっています。
一方で、エポック数の大きいモデルではmAPの値が極端に小さくなっています。
エポック数が小さいモデルでは予測が多く提案されているものの、今回はIOUの閾値を0.5に設定しているため、ある程度予測の数は絞られていると思います。
そのため、そこまでmAPの値が低下しなかったと思われます。
しかし、エポック数の大きいモデルでは、そもそも予測Bboxの提案がほとんどないため、精度が極端に小さくなったと考えられます。
今回のモデルの失敗点は、特徴が掴みづらい疾患を背景とみなすように学習が進んだ点だと思われます.
対策として、Iouの値を変えることで予測Bboxの提案は増やせると思うのですが、学習を進めると結局は今回と同じような結果になるのではと思います。
それらを踏まえて、今後モデルおよび前処理の改善に散り組んでいこうと思います。
モデルの選択について
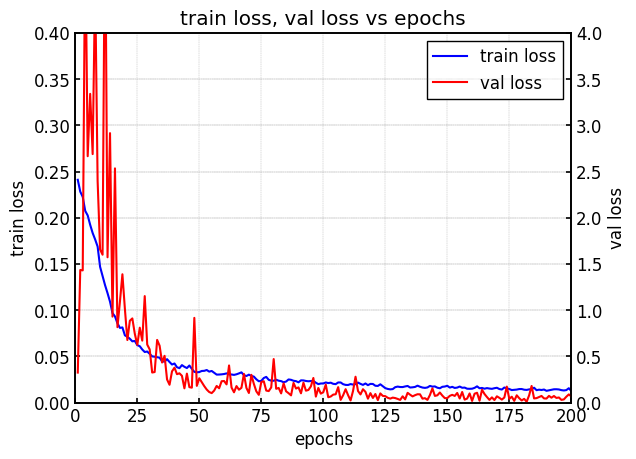 |  |
| Train loss, Val loss vs epoch. | mAP for test data vs epoch. |
左図は学習時のlossをepochごとに示したものです。
学習が進むにつれて、train lossとval lossがともに減少していることが確認できます。
右図はテストデータに対して、各エポック数のモデルを用いて、mAPの値を算出したものです。
右図より、エポック数の大きいモデルほどmAPの値が小さくなっています。
エポック数が増加するにつれて、lossは下がっているが精度は低下するという、一般的な機械学習の傾向とは反対の結果となっている
通常テストデータに適用するモデルを選択する際は、val lossが最も小さい時のエポック数のモデルを採用する。
しかし、今回の場合はlossとmAPの値の間に相関関係がみられず、モデルの選択が非常に困難である。
そのため、今回は特定のモデルに対してmAPの値を算出するのではなく、全てのモデルに対してmAPを算出し、評価を行った。
物体検出モデルを実際の現場で使用する際には、どのモデルを採用するかも重要になるため、今後この点についても検討を重ねていきたい。
コメント